by Michael Hollister
Exclusive published at Michael Hollister on October 21, 2026
3.041 words * about 16 minutes readingtime
Part 2 read here:
Ten Percent, Once, Without Warning – Part 2


What the International Monetary Fund Calculated in 2013 – and How Conditions Have Changed Since
In October 2013, a figure appeared in a report by the International Monetary Fund that continues to circulate today: approximately 10 percent. That, the Fund calculated, was the rate at which a one-time levy on households’ net wealth would have to be imposed to bring eurozone debt ratios back to their pre-financial-crisis levels. The calculation covered a sample of 15 euro-area countries, targeted the debt levels recorded at the end of 2007, and would have applied to every household with positive net wealth.
Two things about that figure need to be made clear from the outset, lest it be remembered incorrectly. The measure concerns net wealth – assets minus liabilities – not a 10 percent charge on every checking account. Someone who owns a house with a large outstanding mortgage and little in savings has little positive net wealth and would therefore be in a very different position from someone who owns property outright. And it concerns the eurozone, not the entire world. For anyone living in the eurozone, that distinction narrows the issue rather than making it less troubling: the calculation was designed for the very currency area in which that person holds their assets.
A Box That Attracted More Attention Than Intended
The figure comes from the IMF’s October 2013 Fiscal Monitor, the Fund’s semiannual fiscal affairs report, titled Taxing Times. Tucked into it was an analytical sidebar on a one-time capital levy, identified in the original as “Box 6.” There, the Fund explained that the sharp deterioration in public finances across many countries had revived interest in such a levy: a one-time charge on private wealth as an extraordinary measure to restore debt sustainability.
The calculation that follows is sober and precise. To reduce debt ratios to their end-of-2007 levels, the 15 euro-area countries under examination would need to impose a levy of about 10 percent on households with positive net wealth. No recommendation, no timetable, no political demand – a modeling exercise. But it was an exercise someone actually conducted, using concrete figures, and the IMF considered the result important enough to publish.
The appeal the Fund attributes to the idea has two sides. One is technical, and it will matter in a moment. The other concerns distribution: a levy on net wealth hits those who own the most the hardest – something some people consider fair, on the grounds that the broadest shoulders should bear the heaviest burden. Together, those two considerations explain why the idea repeatedly gains traction during crises.
It is worth being precise about what this calculation actually does. It answers a single question: How much would have to be taken from the wealthy, once, to bring government debt down to an earlier level in one stroke? Not whether it should be done. Not whether it would be legally possible. But rather: What would the rate have to be? The fact that someone calculated the answer down to a specific percentage is itself information. You do not run the numbers on a 10 percent wealth levy across 15 countries because you happen to have nothing else to do. You do it when circumstances suggest that an answer might be needed.
The Condition on Which Everything Depends
What is truly remarkable about the box is not the rate. It is the condition under which such a levy can even be considered economically “clean.” The Fund sets that condition out openly, and one of its own tax specialists spelled it out even more clearly shortly afterward.
Michael Keen, then deputy director of the Fund’s Fiscal Affairs Department, used an image that compresses the entire logic into a single sentence. Imagine leaving $40 on your kitchen table at night and finding only $30 there the next morning, along with a note from the government: Thank you, we took $10 in tax. Annoying for the person whose money it was. But for an economist, almost the ideal tax, because afterward there is nothing anyone can do to reduce, sidestep, or avoid it – the “holy grail” of a non-distortionary levy. Anyone who had already spent or moved the money the previous evening would have escaped the charge. But the previous evening, nobody knew it was coming.
That is precisely the condition. To avoid distorting economic behavior, Keen wrote, the levy would have to be “both unanticipated and believed certain not to be repeated” – it would have to come as a surprise and be believed to be a one-time event. Both, he added, are very difficult to achieve. If people fear the government will make the same move again, they look for ways to reduce, circumvent, or avoid future levies – and the tax becomes highly distortionary rather than clean. Keen describes the transformation from the holy grail into a poisoned chalice: the very feature that makes the levy so efficient at the moment it is imposed makes it unworkable once people come to expect it.
That sentence deserves a moment’s consideration. The economic justification for the measure requires surprise. It requires that those affected know nothing about it in advance. Introducing a new tax takes time, and as Keen dryly observes, a government can hardly do so in complete secrecy – not least because of transparency requirements. But any advance warning also gives people time to move their assets abroad, draw them down, or hide them. A levy whose effectiveness depends on arriving unannounced is a levy whose underlying logic rules out public debate beforehand. That is not an accusation against the Fund. It is there in the Fund’s own material, stated as a technical characteristic. But it is the characteristic around which this entire instrument revolves – and it will become decisive again at the end, when we turn to the practical obstacles.
Not a Proposal – and Why That Does Not Erase the Calculation
When the box attracted attention in the fall of 2013, Keen clarified what it was and what it was not. There was “no such proposal from the IMF” in the box, he wrote; it merely offered an analytical account of the issue and of historical experiences that had already been discussed publicly. That is correct, and it belongs in the record. It was an analysis, not a proposal. Anyone claiming the Fund demanded a wealth levy in 2013 is overstating the case.
At the same time, Keen said something in that very same piece that places the calculation in context rather than diminishing its significance. The idea of a capital levy had repeatedly surfaced in public debate, “especially after wars” – in other words, after extraordinary events, when extraordinary means are sought to reduce heavy debt burdens. A modeling exercise of this kind does not emerge in a vacuum. It emerges when circumstances give reason for it. In 2013, they did: the financial crisis had driven debt levels sharply higher, the eurozone was struggling with its sovereign-debt crisis, and the question of how those debts could ever be brought down was unsettled enough to justify calculating even the uncomfortable answers.
What follows is a single question, and it belongs to the reader, not the author: Have the reasons that prompted the calculations in 2013 grown weaker or stronger since then? The answer does not lie in speculation. It lies in numbers – and those numbers can be looked up.

Sixty Trillion, Then One Hundred Trillion
Let us begin with the one figure that has actually doubled. In 2013, global public debt stood at an estimated $60 trillion. In 2024, it exceeded $100 trillion for the first time – approximately 93 percent of global economic output, according to the Fund’s calculations, and on a path to reach 100 percent by the end of the decade. So the financing requirement behind the 2013 calculation has not shrunk. It has grown by roughly two-thirds.
That is the global picture, and it is unambiguous. For Europe and Germany, the findings require greater precision, and here precision matters more than dramatic effect. European debt ratios have not doubled. Anyone who claims otherwise gets the numbers wrong and hands every critic an easy rebuttal. The change has taken a different form – and in Germany, one that only becomes clear on closer inspection. That is why it is worth examining the series rather than relying on a single headline.
The Honest Numbers – 2013 Was No Golden Year
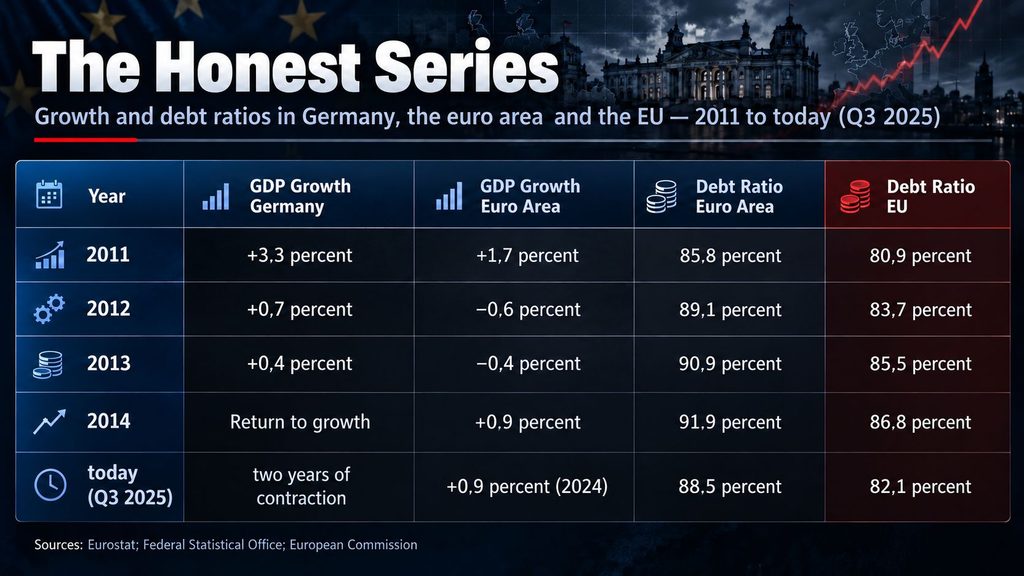
It would be convenient to portray 2013 as a boom year and contrast it with a disastrous present. But that would not be true. For the eurozone, 2013 was a low point. To avoid cherry-picking a single especially weak year, it helps to look at the figures from 2011 through 2014 alongside the more recent numbers.
Sources: Eurostat; Germany’s Federal Statistical Office; European Commission. Debt ratios were still rising from 2011 through 2014 while the eurozone was mired in recession – meaning the Fund’s modeling exercise was conducted amid weak economic conditions and high debt levels.
The eurozone contracted by 0.6 percent in 2012 and another 0.4 percent in 2013; only in 2014 did it barely emerge from recession with 0.9 percent growth. Among the major economies, Germany was virtually the only one to grow that year, and even its growth amounted to just 0.4 percent – down from 3.3 percent in 2011. The year in which the Fund performed its calculation was therefore itself a lean one, marked by high unemployment in the crisis-hit countries and a European Central Bank that cut its policy rate to a record low at the time. And yet – or perhaps precisely for that reason – eurozone debt ratios kept climbing, from 85.8 percent in 2011 to 91.9 percent in 2014.

The increase is even more pronounced in absolute terms: the eurozone’s debt rose from around €9 trillion at the start of the decade to approximately €14 trillion in 2025. Aggregate ratios, however, are slightly lower today than during the crisis years: at the end of the third quarter of 2025, the eurozone stood at 88.5 percent and the EU as a whole at 82.1 percent. Those averages conceal considerable differences – Italy and France carry ratios well above the average, while several smaller member states remain below it. The essential point here is simple: Europe’s debt ratio has not doubled. What has doubled is global debt in absolute terms. And what has changed in Germany is something that no debt ratio alone can reveal.
Germany: A Lower Ratio, a Reversed Fiscal Regime
Germany’s debt ratio is lower today than it was in 2013. Back then, it stood at around 77 percent of gross domestic product; in 2024, it was 62.2 percent, and in 2025, 63.5 percent. In absolute terms, debt rose from approximately €2.22 trillion at the end of 2013 to €2.689 trillion in 2024 and about €2.84 trillion in 2025 – a substantial increase, but by no means a doubling of the ratio, because economic output also grew and the government consolidated its finances in the meantime. Between 2019 and 2024, Germany no longer complied with the Maastricht Treaty’s 60 percent threshold, remaining above it throughout, apart from the pandemic-related interim peak in 2020 and 2021. Anyone speaking of Germany’s “doubled debt” is missing what the numbers actually show.
What matters is not the current level but the direction – and that direction reversed in 2025. A constitutional amendment in March 2025 loosened the debt brake and established a €500 billion debt-financed special fund for infrastructure over 12 years; defense spending above a specified threshold was exempted from the debt rule. After a decade of decline, the ratio is heading upward again. In its August 2025 Monthly Report, the Bundesbank modeled several scenarios for what might follow: the debt ratio could rise to around 66 percent by the end of 2027 and, under the medium-term fiscal plan – with the defense exemption and full use of the expanded fiscal room – to approximately 80 percent by 2029. These are scenario calculations, not point forecasts, but the direction is the same in every case. This is no footnote: it marks a departure from precisely the consolidation path that brought Germany’s ratio down after the financial crisis in the first place.
That gives us a comparison that holds up – without the slightest exaggeration. In 2013, the Fund ran its calculations during a weak year when global debt stood at $60 trillion. Today it stands at $100 trillion, Germany’s economy has contracted in real terms for two consecutive years, and the country has just removed the fiscal straitjacket it had previously tightened around itself. The circumstances that prompted the 2013 calculation have not disappeared. They have accumulated – and the question is what makes up that pile.
One Crisis, With Two More Piled on Top
2013 was the year after the financial crisis – the one great surge in debt that had prompted the calculation in the first place. Since then, not just one more has been added, but several.
The coronavirus pandemic cost public budgets enormous sums and drove debt levels higher across Europe; Germany’s ratio jumped to around 70 percent in 2020 and 2021 before declining again. The burdens of those years have not been paid off; they remain embedded in the debt figures. Added to that is the financial commitment to Ukraine – military aid, budget support, and the substantial cost of taking in refugees – which has strained public finances for years and has no foreseeable end date. Beneath all of this lies a structural break that is eating into ongoing revenues: Europe’s economy, and Germany’s in particular, has moved away from inexpensive energy sources and has paid higher energy prices ever since, while growth hovers near zero and energy-intensive industry loses both production sites and market share.
Any one of these burdens could be managed on its own. The problem is that they are arriving together. In 2013, there was one economic trough, with one cause, and an economy that was at least still growing. Today the trough is deeper, with several causes layered on top of one another, and an economy that is contracting. Set the Fund’s modeling exercise from that time alongside today’s conditions, and what emerges is not a closed chapter from the past but a calculation whose underlying circumstances have since deteriorated. That is not a judgment about what will happen next. It is a statement about how the conditions under which such a calculation is made have changed.
That completes the findings of this first installment. The instrument exists, the numbers have been calculated, and the conditions that led to the 2013 calculation have grown worse rather than eased. What remains open is whether that calculation was a one-time exercise born of a crisis year or part of a recurring pattern – and whether the practical obstacles that thwarted such measures in the past still stand today.
Part two examines both questions: first, the history of the instrument and its quiet return in recent years, and then the two obstacles whose severity will determine whether a modeling exercise can ever become policy.
Part 2 read here:
Ten Percent, Once, Without Warning – Part 2
About the Author
Michael Hollister is a geopolitical analyst and investigative journalist. He served six years in the German military, including peacekeeping deployments in the Balkans (SFOR, KFOR), followed by 14 years in IT security management. His analysis draws on primary sources to examine European militarization, Western intervention policy, and shifting power dynamics across Asia. A particular focus of his work lies in Southeast Asia, where he investigates strategic dependencies, spheres of influence, and security architectures. Hollister combines operational insider perspective with uncompromising systemic critique – beyond opinion journalism. His work appears on his bilingual website (German/English) www.michael-hollister.com and in investigative outlets across the German-speaking world and the Anglosphere.
Stay informed without having to work through the daily flood of news – the most important developments and connections summarized for you.
Sources
- International Monetary Fund, October 2013 Fiscal Monitor – Taxing Times: https://www.imf.org/en/publications/fm/issues/2016/12/31/taxing-times
- European Parliament, Written Question P-011736-13 (wording of the box): https://www.europarl.europa.eu/doceo/document/P-7-2013-011736_EN.html
- Michael Keen, IMF Blog, November 06, 2013 – Once And For All: Why Capital Levies Are Not the Answer: https://www.imf.org/en/blogs/articles/2013/11/06/once-and-for-all-why-capital-levies-are-not-the-answer
- International Monetary Fund / Reuters, October 2024 Fiscal Monitor – Global Public Debt to Top $100 Trillion: https://www.dawn.com/news/1865574
- Eurostat, 2014 Government Deficit and Debt – Debt Ratios, 2011–2014: https://ec.europa.eu/eurostat/documents/2995521/6796753/2-21042015-AP-DE.pdf
- Eurostat / German Federal Statistical Office, Public Finances 2025: https://www.destatis.de/Europa/DE/Thema/Wirtschaft-Finanzen/OeffentlicheHaushalte.html
- Government Debt in Europe – Eurozone and EU, Third Quarter 2025: https://www.staatsverschuldung.de/eu-schulden/
- Debt-to-GDP Ratio and the 2025 Debt Brake Reform: https://www.staatsverschuldung.de/glossar/schuldenquote/
- Deutsche Bundesbank, Public Finances, August 2025 Monthly Report (Debt Ratio Scenarios for 2027/2029): https://publikationen.bundesbank.de/publikationen-de/berichte-studien/monatsberichte/oeffentliche-finanzen-962168
- German Federal Statistical Office / Statista, Germany’s Maastricht Government Debt, 1991–2024: https://de.statista.com/statistik/daten/studie/162986/
- German Federal Statistical Office, German Economy Grew by 0.4 Percent in 2013: https://www.moneycab.com/international/deutsche-wirtschaft-2013-um-04-prozent-gewachsen/
- European Commission, Eurozone Economic Output, 2012–2014: https://www.moneycab.com/international/eu-kommission-eurozone-schrumpft-2013-erneut/
- Research Services of the German Bundestag, WD 4 – 057/12 – Constitutional Limits on a Wealth Levy: https://webarchiv.bundestag.de/archive/2016/0905/blob/408266/07cc941eef8186fbf74f75291dc790bf/wd-4-057-12-pdf-data.pdf
- Berlin SPD, Motion 96/I/2020 – A Wealth Levy for a Fairer Distribution of Crisis Burdens, State Party Conference, October 31, 2020: https://parteitag.spd.berlin/app/uploads/pdf/I_2020//Antrag_96I2020_Vermoegensabgabe_fuer_eine_gerechte.pdf
- Alliance 90/The Greens, Draft Law on the Imposition of a Wealth Levy, Bundestag Printed Paper 17/10770: https://dserver.bundestag.de/btd/17/107/1710770.pdf
- German Bundestag, Wealth Levy – The Left Party’s Motion and Responses: https://www.das-parlament.de/schlagwort/vermoegensabgabe
- Federal Government’s Response to a Parliamentary Question from the AfD Parliamentary Group, Bundestag Printed Paper 20/975: https://dip21.bundestag.de/dip21/btd/20/009/2000975.pdf
- Camille Landais, Emmanuel Saez, Gabriel Zucman, A Progressive European Wealth Tax to Fund the European COVID Response, CEPR/VoxEU, 2020: https://cepr.org/voxeu/columns/progressive-european-wealth-tax-fund-european-covid-response
- Institute for Government, Wealth Taxes – UK Wealth Tax Commission, 2020: https://www.instituteforgovernment.org.uk/explainer/wealth-taxes
- Compulsory Bank of Cyprus Levy Raised to 47.5 Percent (Cyprus, 2013): https://www.verivox.de/geldanlage/nachrichten/zwangsabgabe-fuer-bank-of-cyprus-auf-475-prozent-erhoeht-94558/
- CAN Europe, Position on a Tax on Extreme Wealth (Spain, France, 2023): https://old.caneurope.org/content/uploads/2024/09/CAN-Europe-position-on-a-tax-on-extreme-wealth.pdf
- Historical Capital Levies (Italy, 1992; USA, 1999) – Overview: https://en.wikipedia.org/wiki/Capital_levy
- Sigmar Gabriel on Burden Sharing After the Coronavirus Crisis, dts News Agency, April 17, 2020: https://www.presseportal.de/
- Rose & Partner, Burden Sharing and the Burden Equalization Act: https://www.rosepartner.de/lastenausgleich.html
© Michael Hollister – Republishing Is Expressly Encouraged.
I am pleased when my articles, contributions, and analyses generate interest and are shared more widely. Reproducing, distributing, and publishing my texts, in whole or in part, on other websites, blogs, or in other publications is expressly permitted and encouraged. No prior permission is required.
The only requirement: Michael Hollister must be clearly and prominently identified by name as the author. In addition, a prominent, clickable link to the original website www.michael-hollister.com must be included.
Reuse without author attribution and a link is not permitted.